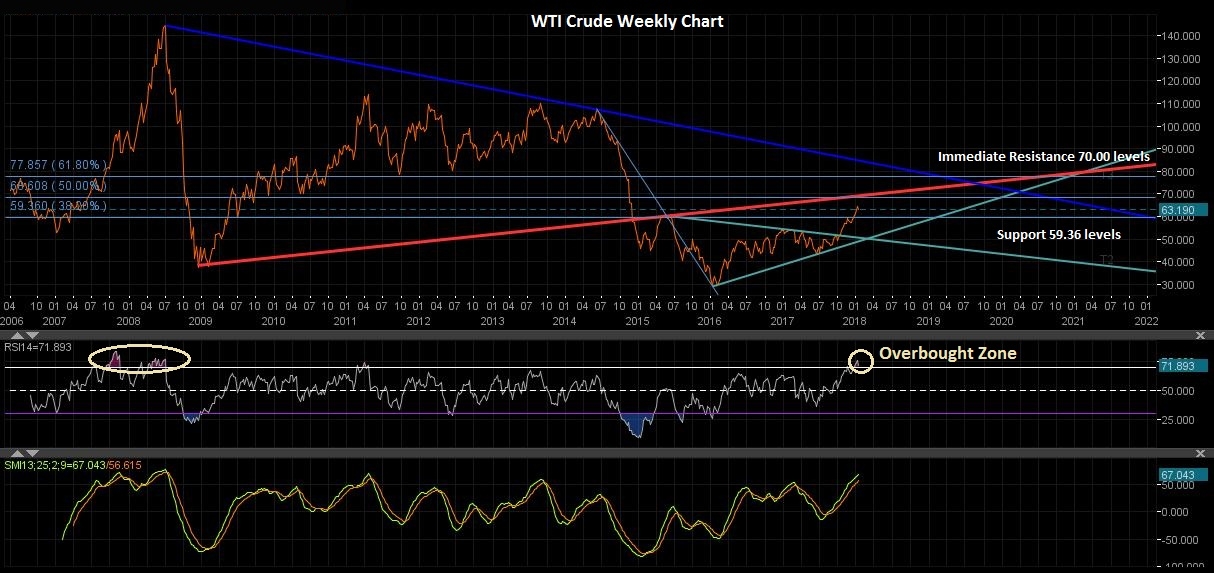
With the ongoing tensions in Iran, and production cuts by the OPEC, there has been no shortage of reasons for the oil prices to push higher. It was seen touching $64.86 levels up by almost 8.65% in the last one month. The rather dormant asset for most of last year has been seen gaining momentum and touching the 2014 levels this month.
There’s no shortage of opinions on which way oil will go next, and consensus remains elusive. However the key factors affecting the oil prices undoubtedly remain:
Fundamentals
OPEC Production Cut:
The OPEC meeting on the 30th of November announced the extension in the production cuts until the end of 2018. On January 21, 2018, OPEC and non-OPEC producers’ meeting will be held in Oman. With the financial institutions increasing their forecast for the Brent prices the main focus of the meeting would be a smooth exit from the ongoing production cut. Any positive news about higher compliance might support oil prices. However, any negative news of unexpected exit plans might pressure oil prices.
Production:
The surge in U. S. production has stalled at least temporarily as the icy winter weather in North America has shut down some facilities. However, most analysts still expect U. S. production to break through 10 million bpd soon. The higher the prices go, the higher the initiative for the US shale producers to pump harder. This would which then lead to an oversupply, potentially risking the oil rally.
Geopolitical issues:
Recent changes in the dynamics of Yemen's civil conflict widely seen as a proxy war between rivals Saudi Arabia and Iran are making it very hard to predict what could happen next in the Middle East. Production is falling fast in Venezuela, the outages in the North Sea in December tightened supplies a bit, and uncertainty over what to expect from the Washington-Tehran confrontation is helping to push up oil.
Global Demand:
A buoyant global economy has bolstered demand, meaning prices could go higher still. OPEC sees demand growing at a brisk 1.5 mb/d in 2018. However demand from countries like China and the United States is still integral to keeping prices from dropping. With these nations on the path of increasing their annual refining capacity, a downturn could also be expected.
The prices are expected to sustain above $60 per barrel and if the global economic recovery remains upeat the prices are expected to reach 75 plus levels. Sustained higher oil prices would mean a significant difference in EM foreign exchange, with upside risks to EM rates. The varying impact on trade positions could create more challenges to net importers of oil while benefiting net exporters. Other risks to be considered are potentially higher rates, the negative impact to growth, and the implications for EM credit.
Technical View
Support Levels
- We can see major support near $59-60 levels, which is 38.00% of Fibonacci retracement levels and high of 2015.
- Weekly RSI is above $70 levels, which is overbought level, we can see some correction in the near future.
Resistance levels
- Next resistance levels would be $66-67, 50% Fibonacci retracement from a couple of years ago.
- Trendline resistance near $68-70 (Redline)
- 61.8% of Fibonacci retracement near $75 level.
Crude has risen by 54% since mid-2017.
Currently hovering at $64 a barrel, it has the two most contradictory forecasts for 2018.
- We recognize trading above $62.50 level; will probably go towards for $66-67 but not expecting above $70 with the current situation.
- To break and trade beyond the $70 level, need major negative news for oil prices. If oil price break above $70level and sustain, we can see price might touch, 61.8% Fibonacci retracement level which is near the $75 level.
- However, if we were to break down below $59-60, we probably go back towards the $53-54.
The one thing that could send prices skyrocketing as if we get a war in the Middle East, as the Iranians and Saudi Arabians are arguing so much these days. Venezuela, Iran and Saudi Arabia top the list of countries that could cause chaos and disorder which would underpin oil prices in 2018.
However, higher oil prices are a real danger to their market share because it could provoke an aggressive response from U.S. shale drillers.
The prices are expected to sustain above $ 59-60 per barrel and if the global economic recovery remains upbeat the prices are expected to reach 75 levels.

